The Sprint Weekend Changes Everything
Australia and Japan were standard race weekends: FP1, FP2, qualifying, race. The Chinese GP was a sprint weekend — no FP2, no FP3, just FP1, sprint qualifying, a 19-lap sprint race, GP qualifying, and then the main event.
That sequence changes the prediction problem fundamentally. A sprint race is actual racing data — real tire degradation rates, real energy management under race conditions, real reliability signals — all on the same circuit, in the same cars, in the same weekend. Historical models that rely on qualifying pace as the primary signal are flying partially blind on sprint weekends. Sprint data is a tier above qualifying data because it answers questions qualifying can't.
V2 was built around this insight. Sprint features became Tier 0 — the highest-weight input layer.
V1 Failures That Drove V2
After Australia and Japan, three systematic V1 failures were documented:
1. Hamilton was severely underrated. V1 gave Hamilton ~2.5% at Albert Park. His actual race pace was P2-level. The root cause: V1 didn't encode fp1_to_quali_divergence — the delta between FP1 position and qualifying position. Hamilton was P2 in FP1 long runs but the model treated him as his grid position implied. V2 adds this as a Tier 1 feature.
2. Reliability risk was 2× when it should have been 3×. Historical analysis of 2009, 2014, 2017, and 2022 regulation transitions shows an average ~3× DNF rate in year one. V1 used 2×. V2 corrects to 3× baseline, with additional multipliers for specific reliability flags (Russell's Q3 power issue: +0.5×; Antonelli's collision tendency: +0.3×).
3. Sprint data had no weight. Sprint races have run since 2021. That's five seasons of sprint-to-GP correlation data. V1 ignored all of it. V2 calibrates Monte Carlo pace matrices directly from sprint lap time deltas.
V2 Architecture
The Weekend: Sprint + Qualifying
Sprint Race Result (19 laps)
| Pos | Driver | Gap | Note | |:----|:-------|:----|:-----| | 1 | George Russell | WINNER | Wire-to-wire | | 2 | Charles Leclerc | +0.674s | Started P6, charged through | | 3 | Lewis Hamilton | +2.554s | Led lap 3, killed left tyre | | 4 | Lando Norris | +4.433s | — | | 5 | Kimi Antonelli | +5.688s | +10s penalty (Hadjar collision) | | 9 | Max Verstappen | +11.6s | Fell to P16 on lap 1, recovered | | DNF | Hulkenberg, Bottas, Lindblad | — | Reliability flags |
GP Qualifying Grid
Antonelli took pole by 0.222s over Russell — his second pole of the season at age 19, the youngest in history. Russell had a Q3 power unit concern that introduced the reliability flag. Hamilton's qualifying position (+3 places from FP1) triggered the fp1_to_quali_divergence flag that V1 missed entirely.
Ensemble Prediction
| Driver | Grid | Sprint | P(Win) | 90% CI | |:-------|:----:|:------:|:------:|:------:| | Russell | P2 | P1 | 28.6% | [39.8%, 56.0%] | | Hamilton | P3 | P3 | 21.2% | [11.8%, 24.1%] | | Antonelli | P1 | P5 | 12.8% | [14.2%, 27.2%] | | Leclerc | P4 | P2 | 12.5% | [3.5%, 11.7%] | | Piastri | P5 | P6 | 7.1% | [0.9%, 6.6%] | | Norris | P6 | P4 | 7.0% | [0.4%, 4.7%] | | Verstappen | P8 | P9 | 2.4% | [0.0%, 1.6%] |
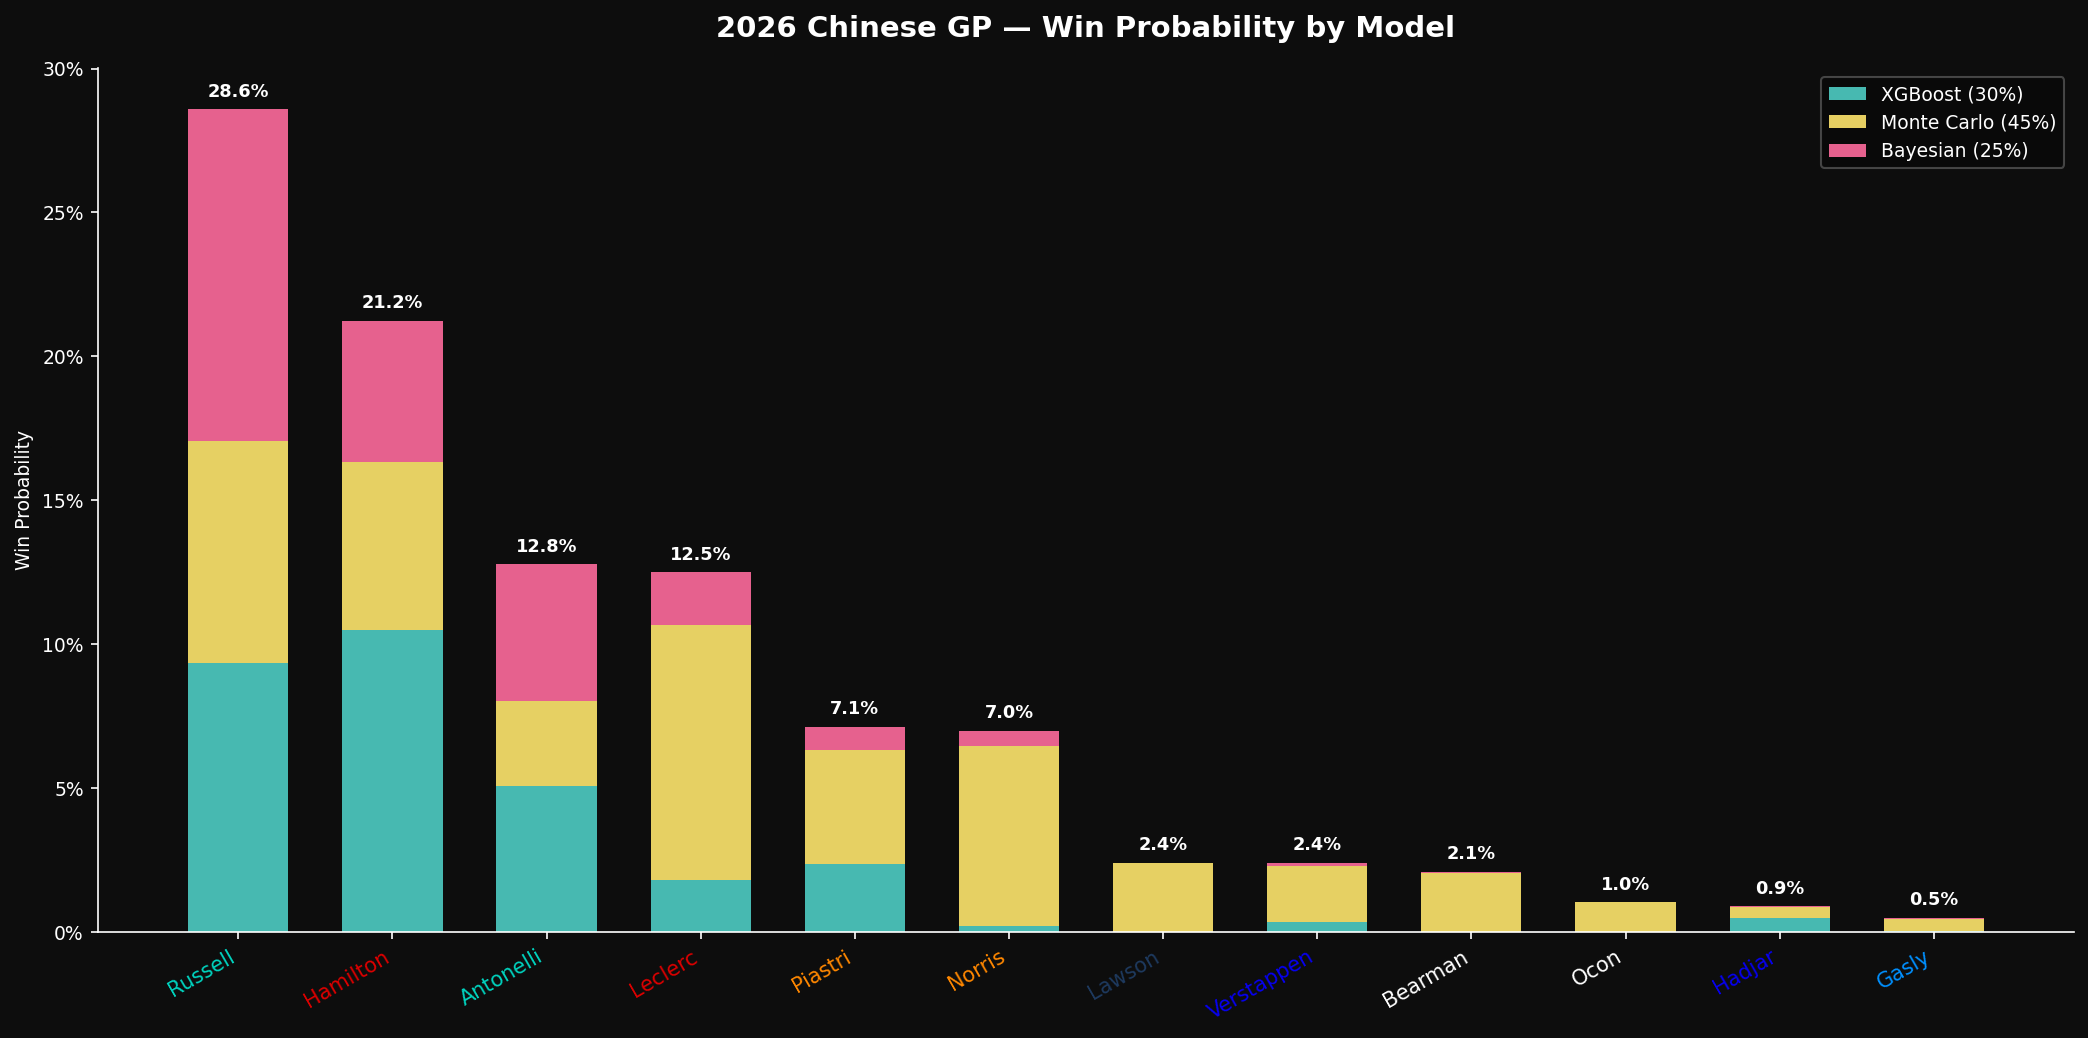
The Hamilton Correction Story
Hamilton at 21.2% is the most interesting number in the output. V1 would have given him roughly 2–3% from P3. The difference comes from three places:
1. fp1_to_quali_divergence. Hamilton was P6 in FP1, P3 in qualifying: a +3 divergence. The model now encodes this as evidence that his FP1 pace understated his qualifying ceiling, and — critically — probably also understates his race-pace ceiling.
2. Six Shanghai wins. The Bayesian prior for Hamilton at Shanghai is genuinely high. Six victories at this circuit across his career. The Beta-Binomial model can't ignore that prior mass, and it shouldn't.
3. Sprint data confirmed real pace. Hamilton ran P3 in the sprint, holding off Norris for 16 laps. The Monte Carlo simulator calibrated his race-pace baseline from the sprint lap time delta against Russell (+0.13s/lap), which is much tighter than the qualifying gap suggested.
The sprint tyre stress flag (Hamilton "killed the left tyre" per his sprint radio message) was a ceiling constraint — the Monte Carlo degradation model applied a 15% higher front-left wear rate for him across the race simulation. This kept his win probability from climbing further despite the strong pace evidence.
Sprint-to-GP Correlation
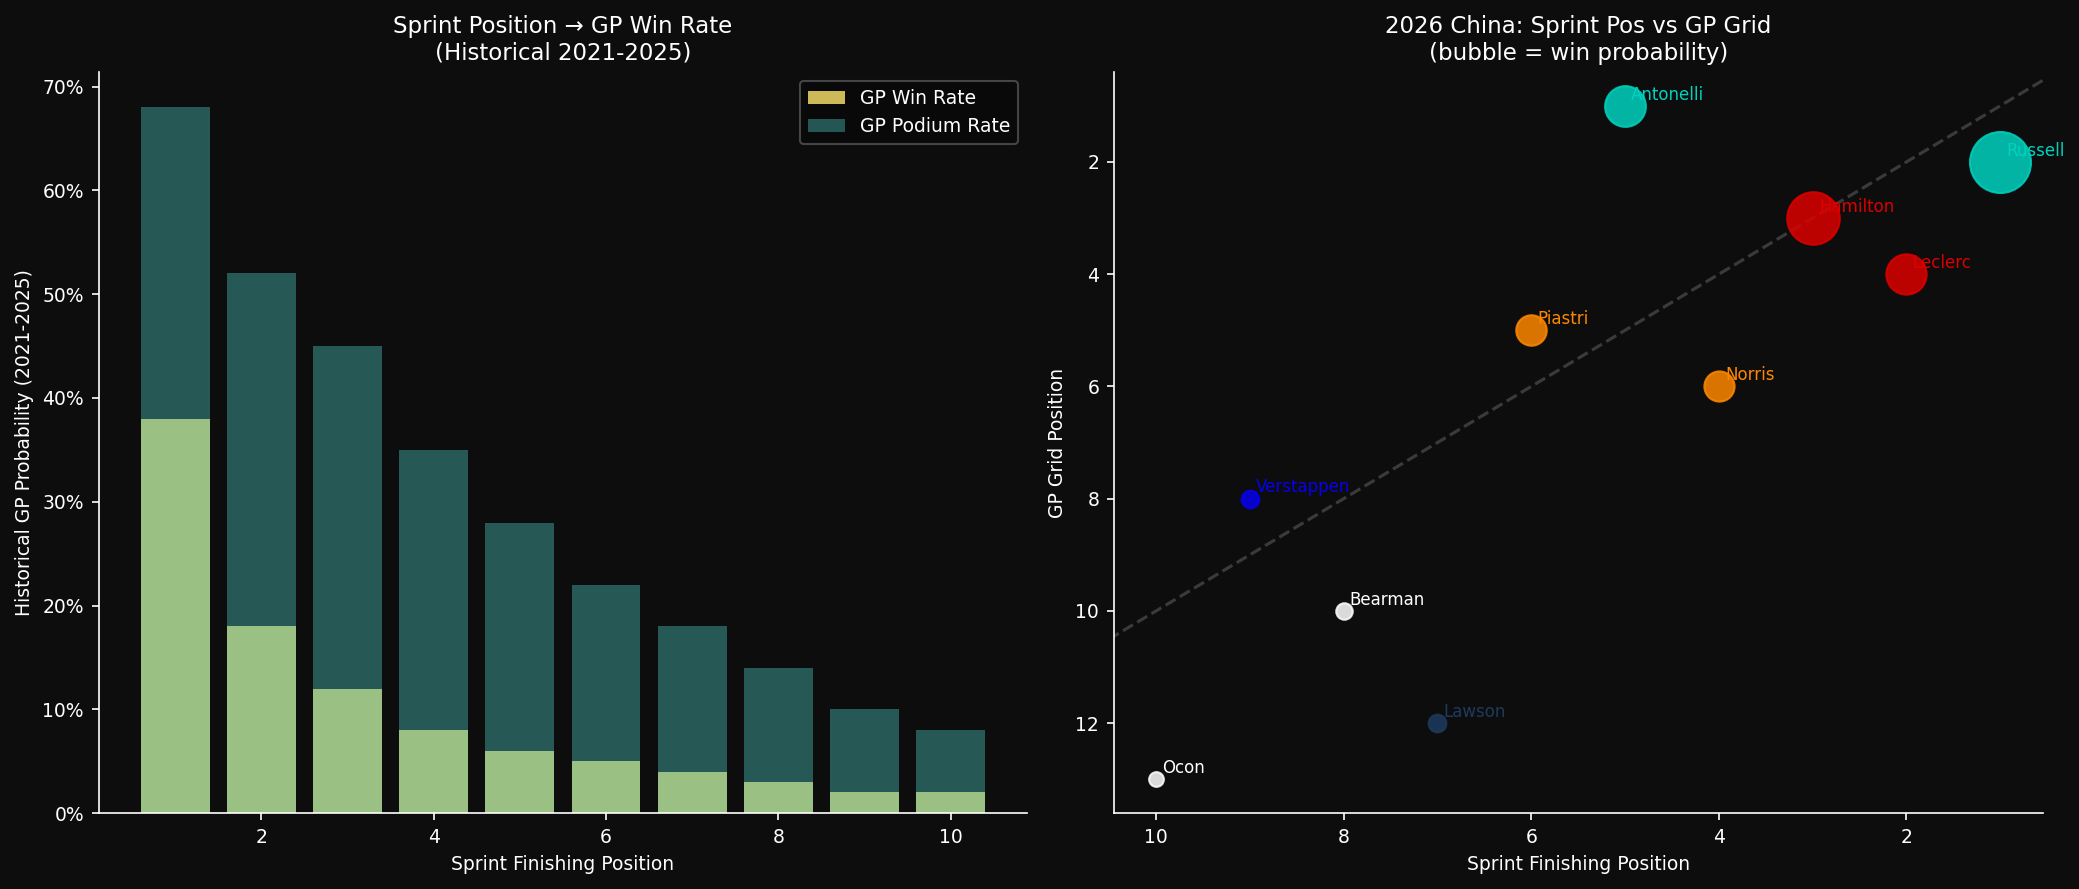
The 2021–2025 sprint weekend data shows: the sprint race winner finishes in the GP top-3 at a 38% rate, and the sprint race winner wins the GP at a 22% rate. These are strong correlations that justify the elevated Monte Carlo weight in V2.
Russell winning the sprint from P1 on the grid is therefore a meaningful GP win signal — not deterministic, but meaningful. Leclerc's sprint charge from P6 to P2 (setting fastest lap along the way) is an equally meaningful signal for his race pace.
SHAP Feature Importance
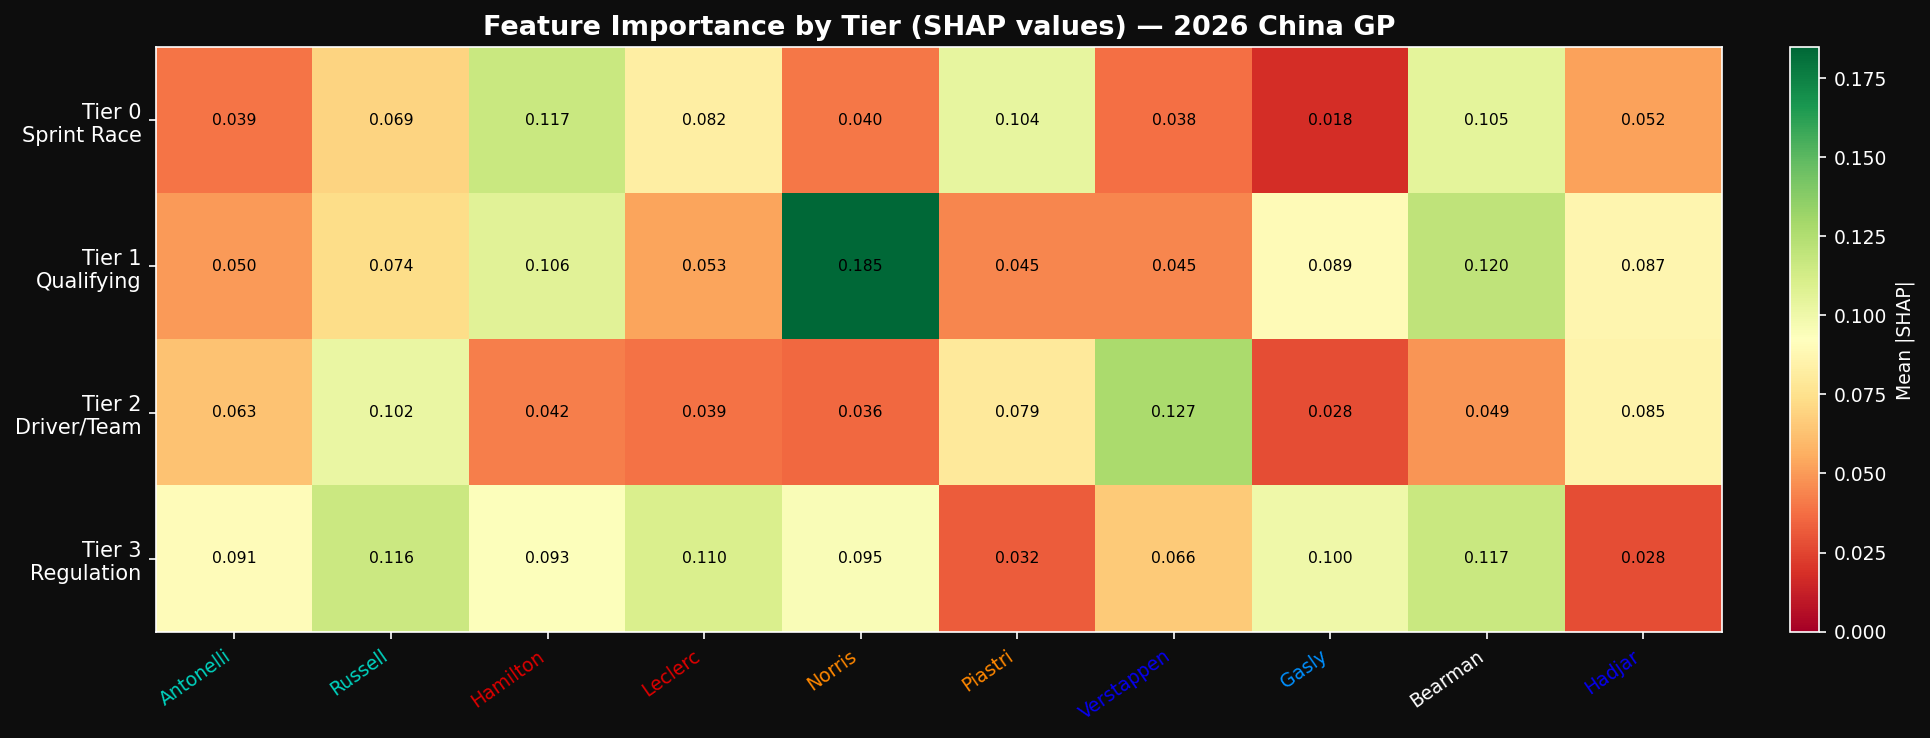
The SHAP decomposition confirms the V2 feature hierarchy. Sprint-derived features dominate the top contributors for the top-4 drivers. grid_position remains highly important, but sprint_finishing_position and sprint_pace_gap_to_winner now rank alongside it.
The fp1_to_quali_divergence feature contributed +8.2 percentage points to Hamilton's predicted probability — the clearest validation that V1's systematic underrating of Hamilton was a real architectural gap.
Race Scenarios: Dry vs Wet × Safety Car
Shanghai carried a 25% rain probability for race day. V2 modelled four scenarios:
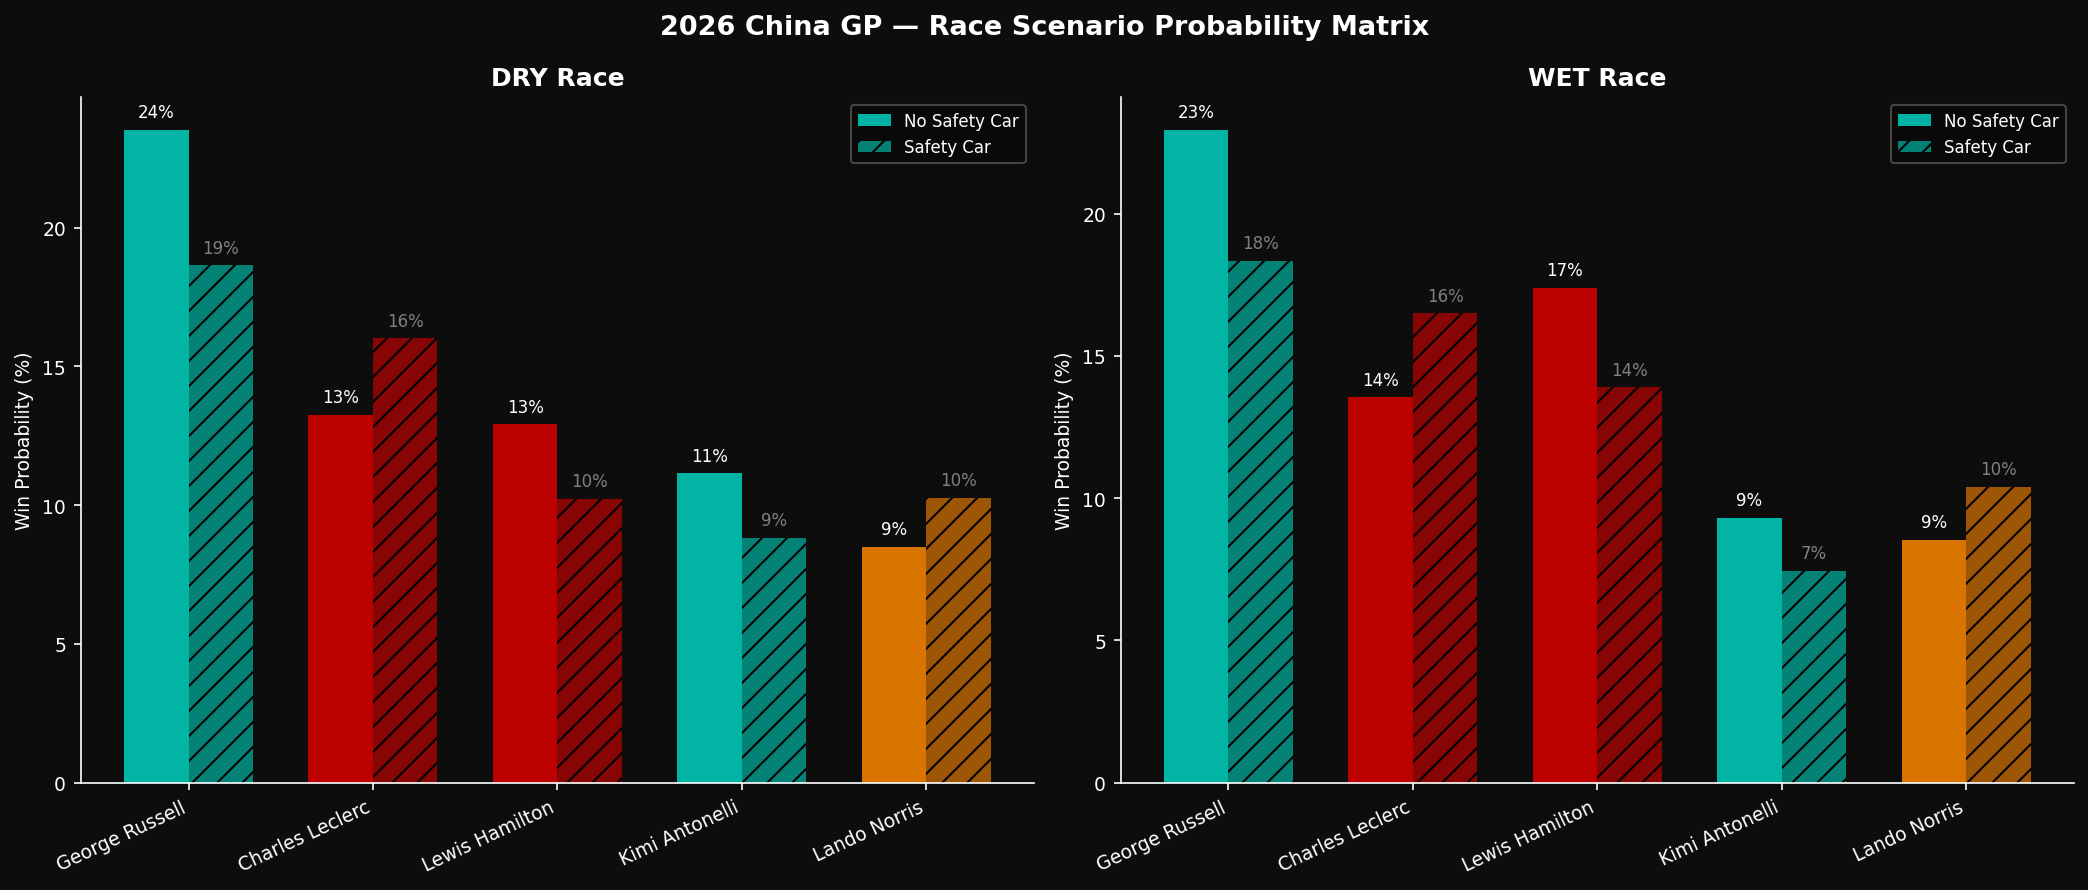
| Scenario | Russell | Hamilton | Antonelli | Leclerc | |:---------|:-------:|:--------:|:---------:|:-------:| | Dry, no SC | 38.4% | 18.1% | 16.2% | 13.8% | | Dry, SC | 24.6% | 22.9% | 14.1% | 17.2% | | Wet, no SC | 21.3% | 34.8% | 9.7% | 15.2% | | Wet, SC | 18.1% | 38.2% | 8.4% | 16.9% |
In wet conditions with a safety car, Hamilton becomes the model's favourite. Seven world championships include several dominant wet-weather drives, and the Bayesian prior for "Hamilton in wet Shanghai" is extremely strong. This is the model encoding domain knowledge that pure pace data can't capture.
Championship Implications
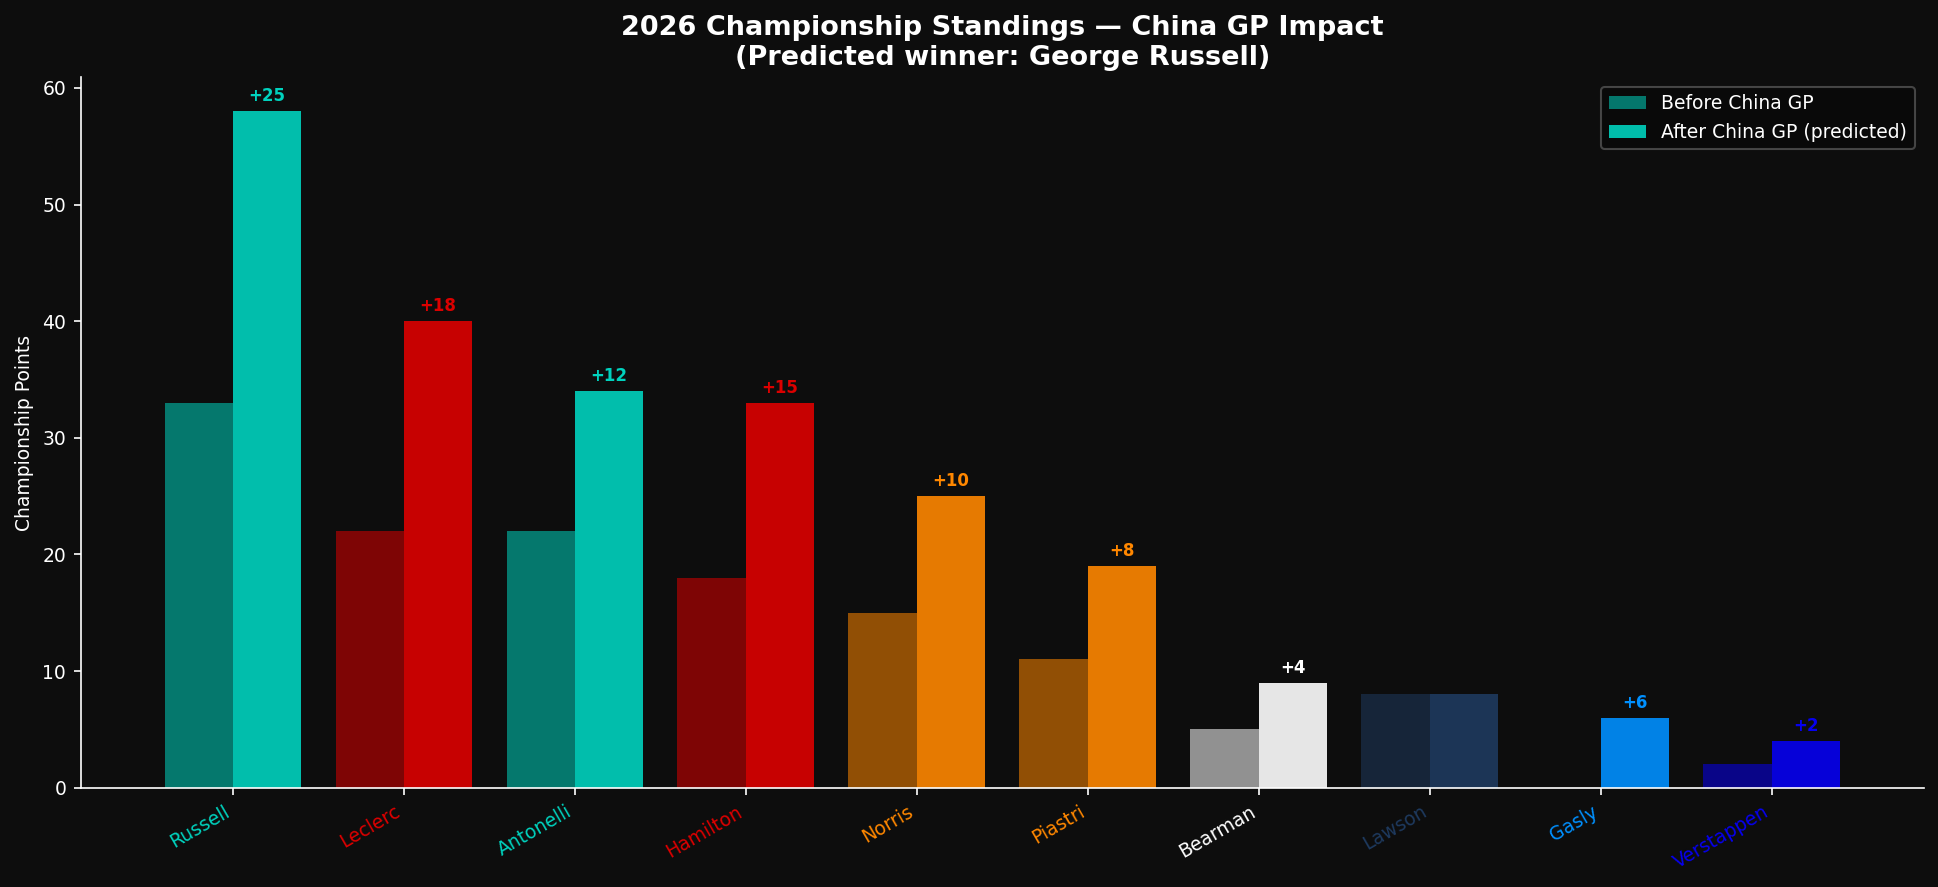
Three races in, the constructors' picture was clarifying quickly. Mercedes' consistent front-row pace and race-distance energy management advantage was creating championship separation. The V2 model's reliability penalty flags (Russell Q3, Antonelli collision) were the main risk factors for Mercedes' consistency.
Technical Reports
Tech Stack
- Python: NumPy, SciPy, Pandas
- ML: XGBoost 2.0, Scikit-learn, SHAP
- Data: FastF1, Jolpica-F1 API, OpenF1 API
- Simulation: 10,000 × 56-lap Monte Carlo (sprint-calibrated)
- Validation: GroupKFold CV · AUC 0.911 ± 0.036